In my quest for unearthing the hidden gems from the Indian micro/small cap space, I come across all types of companies.
Almost 95% of them are mediocre companies, with no great future prospects. Only a handful stand out and deserve a deeper look. And then there are some like Jyoti Resins and Adhesives Ltd, which warrant a deeper look for all the wrong reasons.
JRAL has grown sales at a CAGR of 36% over a 10 yr period. Net profit has grown at an even higher 48% CAGR. Stock price has risen similarly – 52% CAGR. That means a 65x in 10 years! Let’s see what the Company has done to achieve such trailblazing growth!
The basics
The company sells synthetic resin adhesives. They claim that their brand ‘EURO7000’ is the 2nd largest selling wood adhesive brand in India. They launched this brand in 2006.
A cursory glance over the 10 year numbers shows us that the receivables have also grown at a really fast clip of 38%, which is just slightly higher than the Sales growth number.
We can further put the Receivables in context by calculating the Receivables to Sales ratio:

Needless to say, these are extremely high numbers and instead of coming down, they’ve been increasing over the last 3 years. This tells us that the Company is growing without giving any regard to the collectability of cash.
In normal cases, I would get further confirmation of this by looking at the 10 year cumulative figures for Operating Cash Flows vs Net Profits. If the Operating Cash Flow is a lot lower than PAT, that tells you that all profits are being eaten away by working capital. That would be enough for me to reject a company and move on.
In this case however, the figures looked like this:

The 10yr Operating Cash Flows are comfortably higher than the PAT, which is contradictory to our above assertion that they’re growing sales without collecting much cash.
A deeper look
We see from the 10yr cumulative figures above that for the first 6 years the cash flows were indeed lower than the profits. However, something changed from FY16 onwards. In FY20 cash flows are more than double the PAT.
So let’s start with the FY20 Cash Flow Statement to see what it’s made up of:

Before even accounting for the working capital changes, they’ve added 12.42cr to the cash flows on account of the Revaluation Reserve. This amount is higher than even the PBT amount! On the Assets side of the Balance Sheet, we see that this Reserve is created due to change in value of Land.

I don’t have a problem with the revaluation, even though I feel they should have given more details as to why they’ve chosen to do so. However, I don’t think there’s any accounting standard on Earth which would allow a company to add the increased amount of a revalued asset as Operating Cash Flow.
The only situation where this can happen is if the asset has been revalued downwards, and the corresponding entry for that is shown in the P&L. In that case an adjustment in the Cash Flow Statement is valid because it adjusts a previous non-cash expense, much like Depreciation.
Let’s have a look at the FY19 Cash Flow Statement now:

The line which stands out in this is the amount added to the cash flow due to an increase in Provisions, roughly 22cr.
Let’s check the Balance Sheet to see what these Provisions are for:
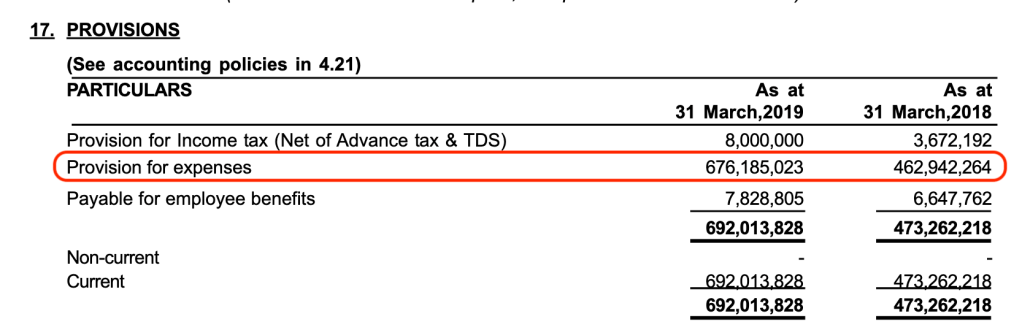
Here we see that “Provisions for expenses” for the year have increased by about 21cr. This is roughly half the amount of the Cost of Materials Consumed in this year, without even a word of explanation given as to what these expenses are for!
In fact, we see this pattern repeating over a 3 year timeframe. Below is the Cash Flow Statement for FY18:
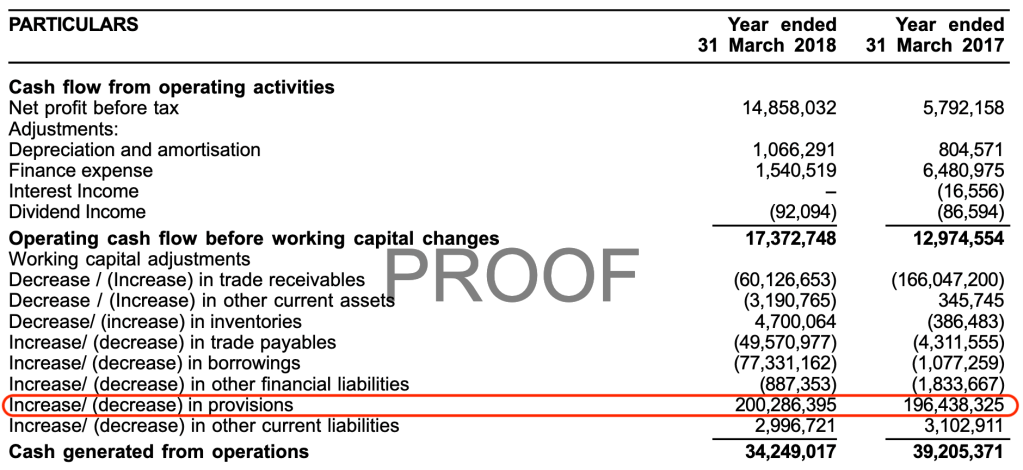
Provisions have added roughly 20cr to the Operating Cash Flows for each of FY18 and FY17 as well.
If we restate the entire Operating Cash Flows by removing the revaluation of Land and only including working capital changes (i.e. only receivables, payables and inventories), we get something like this:

Now this paints a completely different picture. Operating Cash flows are drastically lower than the profits. And they’re not just lower than PAT, they’re actually negative.
What’s the CFO doing?
To get further clues into the functioning of the company, let’s have a look at the remuneration of the management. Below are the salaries paid over the last 4 years. There are 3 members of the promoter family who I’ve clubbed together:
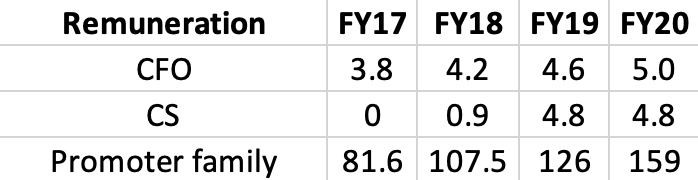
There’s an egregious difference between what the promoters are making vs the top employees. The CFO is barely getting a fresh graduates salary! This tells us how experienced and knowledgeable he/she would be in handling the finances of a listed company.
Conclusion
This is a company where we’ve seen a concerted effort over the past 3_4 years to show much higher cash flows than actual. Receivables have risen to astronomical levels. At best, this is a company which is losing a lot of cash by dumping its products out to its distributors, without knowing whether they’ll get any money from these sales.
